
The Technical Details of Policies for the Nerds Who Care
A deep dive into the design of policies - why pipelines break at scale, how Hyperscan enables constant-time matching, and the tradeoffs we made to get there.
 Jacob Aronoff
The Technical Details of Policies for the Nerds Who Care
Coming from Part One, you may have some questions about how all of this works. This post may get a bit technical and in the weeds, fair warning! Policies are the result of my fourth iteration of designing a data plane and control plane on top of OpenTelemetry. Much of this spawned from discussions relating to OpAMP, OpenTelemetry’s agent management protocol, and dynamic configuration in the OpenTelemetry Operator. The challenges below were discovered after many late night incidents, scaling frustrations, and spirited discussions in OpenTelemetry.
Pipeline Challenges
Performance Bottlenecks
Pipelines are evaluated in series, not parallel. It’s imperative that this is the case because of the dependencies some steps have on each other. For example, if you filter based on data that you expect to be there after enrichment, you need to make sure that enrichment happens prior to that filter step. As you add more steps and rules to a pipeline, the runtime for a single request continues to increase. When a single step slows down, anything upstream will begin to slow down as well. This slowdown compounds with each rule — every match to fix your telemetry becomes an extra toll.
The real cost shows up inside the filter and transform processors, where OTTL rules are evaluated sequentially against every record. A filter processor with a handful of rules is fine, but in practice these lists grow as teams add conditions for different services, environments, and signal types:
processors:
  filter:
    logs:
      log_record:
        - "severity_number < SEVERITY_NUMBER_INFO"
        - 'resource.attributes["service.name"] == "healthcheck"'
        - 'attributes["http.target"] == "/ready"'
        - 'attributes["http.target"] == "/healthz"'
        - 'resource.attributes["k8s.namespace.name"] == "kube-system"'
        - 'IsMatch(body, ".*password=.*")'
        # ... 50 more rules added by different teams
Each OTTL statement is evaluated in order for every log record. At 10 rules the overhead is negligible, but at 100–500 rules — common in large organizations where multiple teams contribute their own filtering and transformation logic — the per-record cost grows linearly. The same applies to the transform processor:
processors:
  transform:
    log_statements:
      - context: log
        statements:
          - 'set(attributes["env"], "production") where
            resource.attributes["k8s.cluster.name"] == "prod-us-east"'
          - 'delete_key(attributes, "user.email")'
          - 'replace_pattern(attributes["http.url"], "token=[^&]*",
            "token=REDACTED")'
          - 'set(severity_text, "INFO") where severity_number >= 9 and
            severity_number <= 12'
          # ... 100 more transformation rules
Every statement is another sequential evaluation per record. At high throughput, this compounds — a pipeline processing 100K records/sec with 200 OTTL rules is executing 20 million rule evaluations per second, all in series.
Portability Concerns
Pipelines are incredibly powerful, but there is no universal syntax for the
outcomes all operators want. Users need to know how to write and convert between
VRL (vector), OTTL (otel), relabel rules (Prometheus), and Lua (FluentBit) to
properly manage their telemetry. To illustrate, here is one simple goal —
dropping metrics with the label user_id — expressed in four different
configuration languages:
OpenTelemetry Collector (OTTL):
processors:
  filter:
    metrics:
      datapoint:
        - 'attributes["user_id"] != nil'
Prometheus (relabel rules):
metric_relabel_configs:
  - source_labels: [user_id]
    regex: ".+"
    action: drop
Vector (VRL):
[transforms.drop_user_id]
type = "filter"
inputs = ["source"]
condition = '!exists(.tags.user_id)'
FluentBit (Lua):
function cb_filter(tag, timestamp, record)
  if record["user_id"] ~= nil then
    return -1, 0, 0 -- drop
  end
  return 0, 0, record
end
Four syntaxes, four mental models, one outcome. An operator managing a fleet that includes Prometheus scrapers, a Collector gateway, and Vector agents needs to express this rule three separate times and keep them in sync.
Users aim to filter and transform data coming from the even greater field of SDKs emitting this telemetry. The nature of these DSLs, however, is antithetical to embedding these outcomes in the SDKs themselves. Currently, the SDKs have a few methods for configuring these types of rules, though recently OpenTelemetry stabilized the declarative configuration for SDKs which should alleviate some of these pains. Ultimately, operators want to be able to solve the problem at the root rather than needing to constantly patch state and build a brittle configuration.
OpAMP was designed to solve parts of this problem, but it inherits the same
fundamental portability issue. OpAMP works by sending full configuration to a
component — a Collector, an SDK — and having that component reload. The problem
is that a controlling server needs to deeply understand the configuration format
of every component it manages. In practice, every vendor ships their own
Collector distribution with custom processors. If you're running custom
processors from three different vendors, your OpAMP server needs to understand
all of their configuration schemas to generate valid config. Most don't, and the
ones that do are tightly coupled to their own distributions. The value of OpAMP
as a universal remote control diminishes quickly when the server can only speak
one dialect. This problem compounds further with SDKs. Declarative configuration
for SDKs uses an entirely different schema than Collector configuration — a
custom metric filtering component in a Java SDK looks nothing like a transform
processor in a Collector pipeline. An OpAMP server that wants to control both
needs to generate and merge two completely different configuration languages,
understand the component landscape of each, and somehow ensure neither breaks on
reload. There's already friction trying to use the same OpAMP server for both
the Collector's
OpAMP Supervisor
and the OpAMP Bridge
in the Operator, precisely because they speak different configuration languages
and have different expectations for what a valid config looks like. Policies
sidestep this entirely by centralizing the configuration language. A policy
looks the same whether it's targeting an SDK, a Collector, or any other
component that implements the spec. The controlling server doesn't need to know
what distribution you're running or what custom components you have installed —
it just sends policies.
Global Reasoning and Configuration Merging
As a maintainer for the OpenTelemetry helm charts and OpenTelemetry operator and having managed multiple pipeline tools across a global fleet, I know firsthand how challenging it is to merge and validate pipeline configuration. JSON/YAML are inherently brittle to configuration merge conflicts. There is no support for things like merging lists, deleting values from a map, renaming, or referencing previous files.
For example, suppose a platform team defines a base Collector config:
# base.yaml — owned by platform team
service:
  pipelines:
    logs:
      receivers: [otlp]
      processors: [batch, resource]
      exporters: [otlphttp]
Now team A wants to add a filter processor and team B wants to add a transform processor. Each submits their own overlay:
# team-a.yaml
service:
  pipelines:
    logs:
      processors: [batch, resource, filter]
# team-b.yaml
service:
  pipelines:
    logs:
      processors: [batch, resource, transform]
When these are merged, the processors list is not appended — it's replaced.
Whichever file loads last wins, silently dropping the other team's processor.
There is no error, no warning. The same problem applies to Prometheus rule files
when teams layer their own metric_relabel_configs on a shared scrape config —
the last list wins.
When working with pipelines, you need to set many constraints to prevent these issues. We’ve been asked many times to provide these types of features in the OpenTelemetry Operator. A quick glance through that issue will reveal the use case and pain people have with pipeline configuration at large scales today. Many maintainers have attempted to solve this, but none of our proposals left the POC stage because the complexity is too great.
Users want to be able to set a base configuration and then allow teams to add their own set of limited configuration. We would need some way to guarantee that all of the configuration rules that users want to add are valid and won’t break another team’s rules. We also have no guarantees about what the collector binary is actually able to support (though this issue is not unique to the OpenTelemetry ecosystem). The Axoflow team has done a great job attempting to support this. Pipeline configurations then grow to many thousands of lines, becoming difficult to understand the telemetry’s flow. This size quickly becomes the source of its own dreaded debugging hell when determining the reason for a part of the pipeline – a house of cards.
The demand for this is loud and well documented. Beyond the primary
distributed collector configuration
issue, users have filed requests for
modular pipeline composition via separated CRDs,
support for multiple config files,
self-service logging CRDs,
and even
opinionated CRDs
that would abstract away the configuration complexity entirely. One commenter on
the distributed configuration issue describes managing 30 clusters with 4,000+
nodes and 70,000 pods, needing teams across namespaces to independently manage
their own destinations and filtering rules. Others describe wanting to separate
infrastructure-managed config from application-team-managed config — platform
teams own the pipeline topology while developers manage their own sampling and
filtering without touching the OpenTelemetryCollector CRD. The technical
barriers are equally well understood. The Collector’s config merging has
historically
clobbered arrays rather than appending them,
meaning merging two pipeline definitions silently overwrites component lists. A
merged RFC
now introduces append merging strategies with an
experimental implementation
in confmap, but merge order remains
semantically significant
because processor ordering matters, and ambiguous merges still happen silently
with no feedback to the user. Maintainers have explored proposals for
CollectorGroup CRDs with ordered merging and separate
receiver/exporter/pipeline CRDs, but each attempt surfaces new edge cases —
image version conflicts between fragments, environment variable collisions, and
the combinatorial explosion of validating composed configurations across the
full set of possible Collector components.
Remote Configuration Challenges
Users often wish to update their pipelines in real time so they can respond to issues quickly and react to external state changes. These users wish to do so without CI/CD or complex rollouts which can take over an hour. Pipeline tools, however, are not set up to handle remote configuration out of the box. Many tools support dynamic configuration by requiring a full reload of a config file via an external supervisor and a SIGHUP signal. This requirement slows down (and potentially drops) in-flight requests and may even break the pipeline if an invalid configuration is loaded.
The Collector's OpAMP Supervisor follows this sequence on a remote config update:
- Receive new configuration from the OpAMP server
- Write the full config to disk, replacing the previous file
- Send SIGHUP to the Collector process
- Collector shuts down all pipelines (draining in-flight data)
- Collector parses and validates the new config
- If validation fails, the Collector crashes and the Supervisor must restart it
- If validation passes, all pipelines are rebuilt and restarted from scratch
Configuration validation can be challenging for pipelines because of the aforementioned reasons, and is often ignored during remote configuration to not further add latency to the reload process. For example, consider two users updating the same Collector config concurrently:
# User A renames the pipeline
service:
  pipelines:
    metrics-cleaning: # was “metrics-filtering”
      receivers: [prometheus]
      processors: [filter, batch]
      exporters: [otlphttp]
# User B adds a processor to the old pipeline name
service:
  pipelines:
    metrics-filtering: # this pipeline no longer exists
      processors: [filter, transform, batch]
User B's config references a pipeline that user A just renamed. On reload, the Collector fails validation and crashes — taking all pipelines down, not just the one being modified.
Designing Policies
Coming into the design process, we considered these challenges as key problems to solve. Performance under high load is a key factor for user adoption, and ideally high performance is a natural result of this work. The OpenTelemetry group working on the arrow project is a massive inspiration for this design. The key insight they had was that changing the underlying data model could result in huge gains and a more extensible system. Policies are ultimately similar — what if by constraining the data model we could actually enable a new class of use cases that our users are excited about? A single policy works by focusing on a single group of telemetry through a simple set of regex matching conditions. Policies can then be deterministically merged into a compiled database. Telemetry can then be matched in parallel and each of the matched policies is merged then run.
The simple defined schema for a policy is lightweight and can be run and validated anywhere (browser, SDK, pipeline tool, etc.). By having a clearly defined merging behavior and using this regex matching syntax, we can add as many policies from as many sources as we want and always get deterministic behavior. Policy implementations define their policy providers, dynamically compiling snapshots that can be easily swapped into the hot path. Precompiling these snapshots also allows pinpointing any potential failures for a single policy, avoiding the swiss cheese problem with debugging merged configurations. This design enables a true telemetry data plane and control plane that hasn’t previously been possible. Vendors can now give users intelligent policies and apply them dynamically in user infrastructure. While we expect a control plane to be the most powerful way to take advantage of policies, we also know that some users will want simpler providers like files, blob storage, and even git.
Tradeoffs
We do make a few trade-offs in this design, as we aim to achieve high performance for large scale applications.
No user-defined ordering. You cannot specify that policy A runs before policy B. This is intentional—ordering creates dependencies, and dependencies break the independence that makes policies scale. The trade-off is less flexibility. If you need strict ordering, you need separate processing stages outside the policy system.
No conditional logic. Policies don't support if/else or branching. Each policy is a simple predicate and action. Complex conditional logic belongs in your application code, not your telemetry processing. This keeps policies easy to understand and easy to generate.
No cross-policy references. A policy cannot reference another policy's output or depend on another policy having run. This limits composition but ensures every policy is self-contained, allowing a user to run a policy anywhere and verify its correctness. You can reason about each policy in isolation.
These constraints exist because the primary goal is scale—tens of thousands of policies executing efficiently. Every feature that adds complexity makes that goal harder. The spec intentionally stays minimal.
Tero’s Policy Suite
We’ve been developing a number of ways to take advantage of policies. First, we are working with Josh Suereth and Raphael Menderico at Google and Jack Shirazi at Elastic to design a proposal to OpenTelemetry to get this first-class support within the project. The proposal is in its design phase and can be read in full here. While we design the OTEP, Tero has been working on the next phases of a specification and implementations. We currently publish policy implementations in Rust, Go and Zig. With the go policy package, we have also developed a lightweight processor in the OpenTelemetry Collector.
Zig has been our testing ground for how far we can take policies in the future. We picked Zig as our primary language for this for a few reasons. First, Zig is obsessed with performance; the syntax gives you precise access over allocations, allowing us to provide a policy implementation that makes zero heap allocations on the hot path. Next, as we’ve already seen with the opentelemetry-injector project, Zig is incredibly portable with fast build times. Theoretically, we could package the policy implementation to be embedded within other languages with no external dependencies (though for now we are not doing this).
All implementations are designed to be idiomatic for their languages, rather than designing with one set of APIs. The goal for each implementation is to limit allocations and enable high-performance use cases with support for dynamic configuration via a list of policy providers. Each implementation does share the ability to be configured in the same JSON format as well as supporting the protojson format from the specification. The internal implementations are all relatively similar though. The core of each implementation looks something like this:
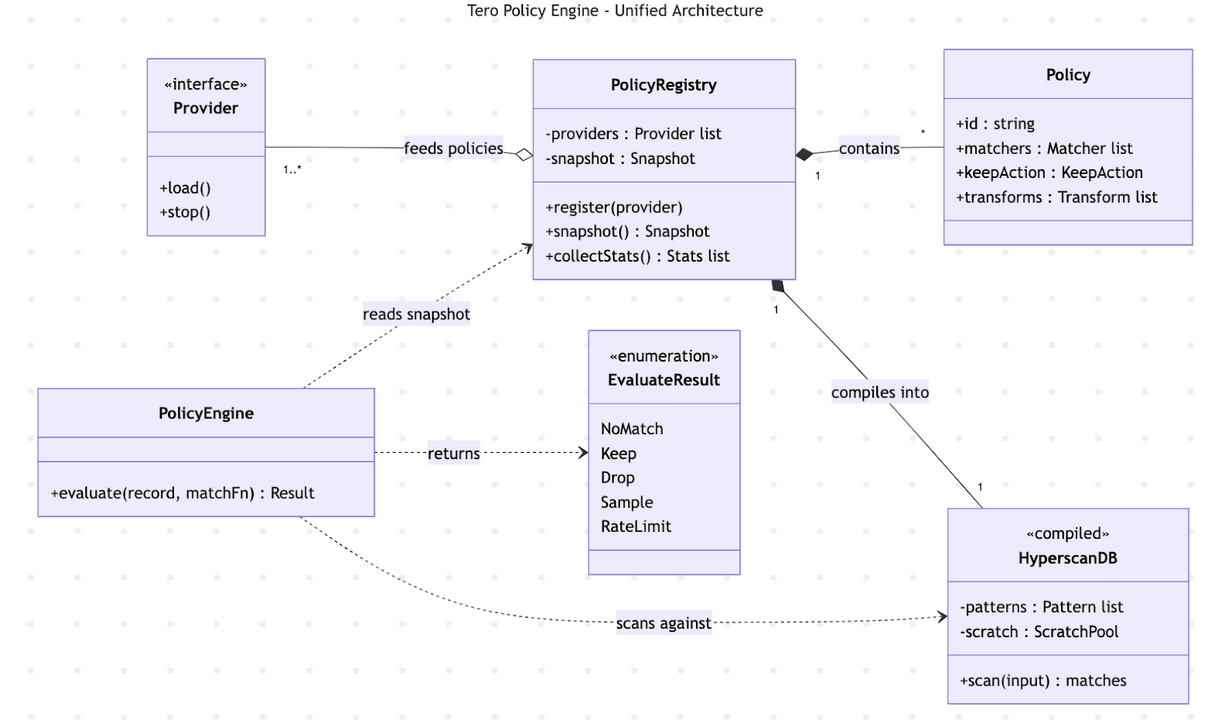
An implementation is instantiated with a list of providers which feed policies to the registry. The registry compiles a list of hyperscan databases into a snapshot on a provider update. A user calls the PolicyEngine’s evaluate method with a record to match and an accessor function which informs the policy implementation how to access policy-relevant fields in the record (log body, trace name, attributes, etc.). The implementation then runs through the hyperscan databases in parallel, merging the matched policies and then evaluating them. For any records that are kept, the next policy stage is run (transformations) and the process is complete.
Hyperscan is the real unlock for policies and is what enables constant time
lookups for policies. Hyperscan works by compiling the regex matchers by match
type (a constrained set of fields in the policy spec) into a set list of
databases. Then, for each database, the field is accessed via the visitor
pattern and run through the database. Hyperscan doesn't support negated regex
patterns — there's no lookahead ((?\!...)) or lookbehind ((?\<\!...))
in the supported constructs list.
So to support policies with negated matchers, we construct a set of negated
databases, running through them and short-circuiting if a pattern matches. When
matching, we use a preallocated pool of scratch memory to run Hyperscan in
scratch mode, avoiding the extra allocations on the hot path. There are a few
cool features of hyperscan we don’t take advantage of today, namely database
serialization – in the future we could support policy providers that send over
compiled hyperscan databases rather than needing the implementations to compile
their own databases.
In order to ensure consistency across the language libraries, we developed a conformance suite with around 160+ tests. These tests cover everything from filtering logs to properly forwarding w3c tracestate when a span is sampled. We also verify that each language can read the same policy files and work on the OpenTelemetry data format.
What's Next
The current spec covers filtering, sampling, and transformations, but policies as a model unlock significantly more. Metric aggregation and downsampling, span rollups, and memory limiting are all natural extensions — each is a self-contained action on a matched group of telemetry, exactly the shape policies are designed for. Adding a new policy type for any of these doesn't change the matching, merging, or compilation model. It's just another action on the other side of the match.
We're also working on the policy aggregator, a special provider that pulls policies from multiple sources, merges them, and serves a single compiled snapshot downstream. Today, each policy implementation compiles its own databases from its own set of providers. The aggregator centralizes that compilation step — decreasing reload latency at the edge, improving delegation across teams, and giving operators a single point to validate and audit the full set of active policies before they hit production. This is where the multi-stage architecture described in the OTEP starts to come together: an aggregator feeding compiled snapshots to SDKs, daemon collectors, and gateways, each applying the same policies without needing to know about each other.
If you're interested in the design, the OTEP is in active review and we'd love your input. The full specification and implementations in Rust, Go, and Zig are all open source. Try them, break them, and tell us what's missing.
Note! Find Jacob at KubeCon EU March 23rd-27th 2026 in Amsterdam to chat more, or reach out at [email protected].