
Introducing Policies
We benchmarked Tero policies against traditional observability pipelines to measure accuracy and cost savings. Here's what we found.
 Jacob Aronoff
Introducing Policies
You cannot have an effective observability strategy when you're stuck balancing consistency, cost, and urgency across a global telemetry architecture. The tooling exists — OpenTelemetry, Prometheus, Vector, Elastic — but the configuration layer that ties it all together is a house of cards. Filtering, transforming, sampling, enriching: it's brittle, high scale, fast paced, and stressful. If you've worked at a large enough company you've seen this firsthand.
Powerful tools like OpenTelemetry, Elastic and Prometheus were a godsend when I was an SRE. This all felt right when I was managing a single Kubernetes cluster, but as soon as we had to manage clusters across regions and continents it broke down. I remember conversations like this:
Our CICD didn't apply this patch in the EU…
Oh no… that high-cardinality prometheus metric cost HOW much this weekend?
why is debug logging on for our noisiest service?
an engineer thought they applied it to dev only
Policies enable a new type of telemetry data and control plan, giving real-time controls directly to users.
Introducing Policies
Policies are portable pieces of configuration that can run anywhere – part of your application, a telemetry proxy, embedded in a pipeline tool, even an observability vendor. Think of them as a universal rule syntax for telemetry – a hybrid of OTTL, Prometheus relabel rules, and VRL but without a DSL. If you define a policy for dropping high cardinality attributes like `user.id`, you'd want that same outcome whether you ran it in Prometheus on scrape or in a collector processor. Policies are typed and self-describing, so policies of the same type are designed to be deterministically merged. They're standalone and idempotent with no external requirements, no complex workflows. Operators can run a policy anywhere in the data plane and the outcome is always the same. Dynamic updates are first class; a policy implementation should be reactive and quickly respond to externally defined changes, enabling use cases like enabling debug logging for 10 minutes or temporarily reducing your sample rate.
{
  "id": "drop-debug-logs",
  "name": "Drop debug and trace logs",
  "log": {
    "match": [
      {
        "log_field": "severity_text",
        "regex": "^(DEBUG|TRACE)$"
      }
    ],
    "keep": "none"
  }
}
A policy works by focusing on a single group of telemetry through a simple set of regex matching conditions. An implementation is instantiated with a list of providers which feeds policies to the registry. The registry compiles those conditions into a set of Hyperscan databases – one per match type – and snapshots them into the hot path. When a record comes in, each database is evaluated in parallel via the visitor pattern, matched policies are merged, and the result is evaluated. Hyperscan is the real unlock here: by compiling regex matchers into databases ahead of time, lookups are constant time regardless of how many policies you have. Precompiling snapshots also means failures can be pinpointed to a single policy, avoiding the swiss cheese debugging problem of merged configurations. This design enables a true telemetry data plane and control plane that hasn't previously been possible – vendors can give users intelligent policies and apply them dynamically in user infrastructure.
But What About Pipelines?
You might be thinking: can't pipelines already do this? Pipelines are incredibly powerful tools for schema translation, telemetry collection and routing, however, they have fundamental limitations that become painful at scale.
Pipelines are evaluated in series, not parallel – dependencies between steps require it. Adding more steps and rules increases the latency per request, and when a single step slows down, anything upstream slows down with it. This compounds with every rule. In a recent LinkedIn post, Juraci from OllyGarden called out this very issue; even with a fan out pipeline, one exporter can slow down the others in the group despite it seemingly being parallel.
There is also no universal syntax for the outcomes operators want – users need to know how to write and convert between transformation syntaxes like VRL, OTTL, Prometheus relabel rules, and Lua. Operators want to solve the problem at the root, but the nature of these DSLs is antithetical to embedding outcomes in SDKs themselves.
Configuration merging and remote updates compound the problem further. JSON/YAML are inherently brittle to merge conflicts – there's no support for merging lists, deleting values from a map, or referencing previous files. As a maintainer for the OpenTelemetry helm charts and operator, I know firsthand how challenging it is to let teams safely layer their own configuration on top of a base without breaking each other's rules. Pipeline configurations grow by many thousands of lines and become their own debugging hell. Remote configuration makes this worse: most tools handle dynamic config by reloading a file via SIGHUP, which slows down or drops in-flight requests and can crash the pipeline if an invalid config is loaded. Say user A renames a pipeline while user B is trying to modify it, the tool fails validation and crashes. Users want to update pipelines in real time without CI/CD – but pipelines aren't built for it.
Policies are not meant to replace pipelines. They exist to make pipelines more powerful by letting them focus on what they're good at, while policies handle the filtering, sampling, and transformation logic that doesn't belong in a serial processing chain.
Benchmarks
We compared the OpenTelemetry Collector (contrib-distro), Vector, Tero's Edge
Proxy, and a modified OpenTelemetry Collector with the policy-go implementation,
generating 0 to 4000 policies for the policy-aware binaries and equivalent rules
in OTTL and VRL for the others. Each benchmark was run at 200,000 total requests
with 150 open connections using oha, on a 16 core M4 Ultra Mac Studio. You can
read more details here.
Requests Per Second by Telemetry Type
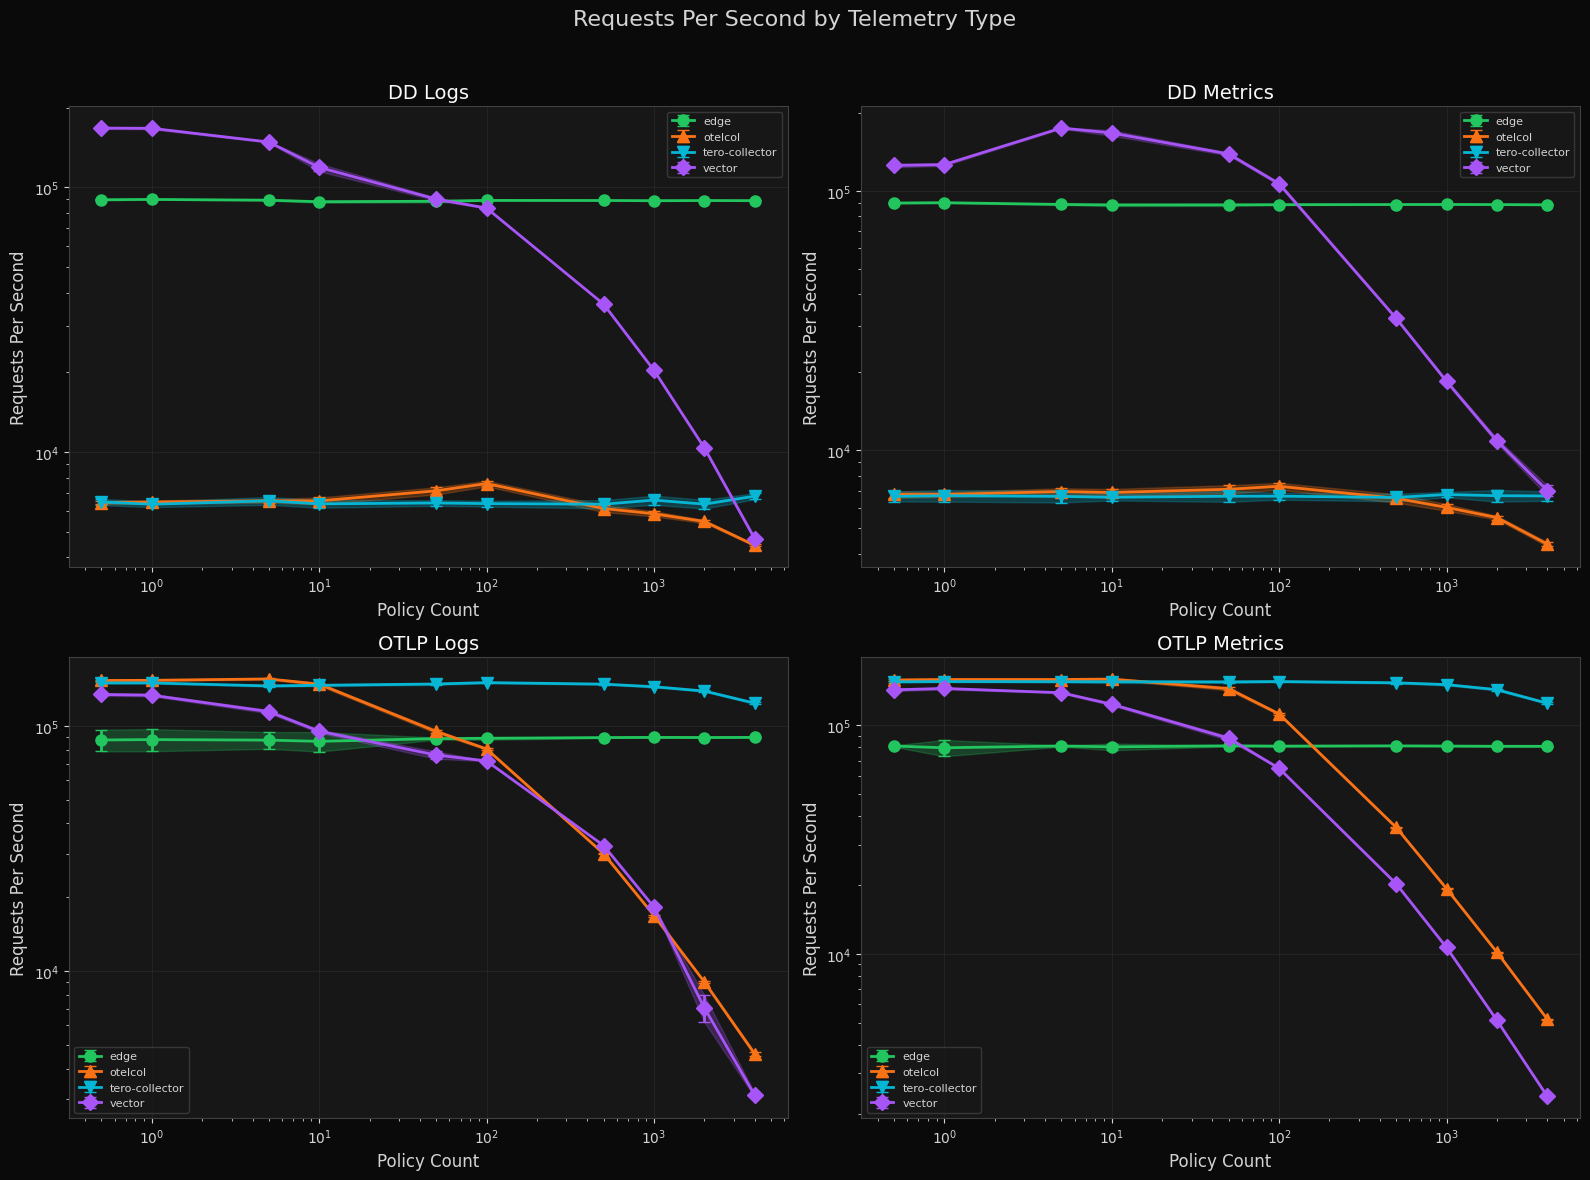
Both tero distributions hold around 100k RPS no matter the amount of policies given to them. Otelcol and Vector degrade exponentially as the number of policies increase, with Vector falling from 200K to under 1K RPS on OTLP logs at 2000 policies.
Memory Usage by Telemetry Type
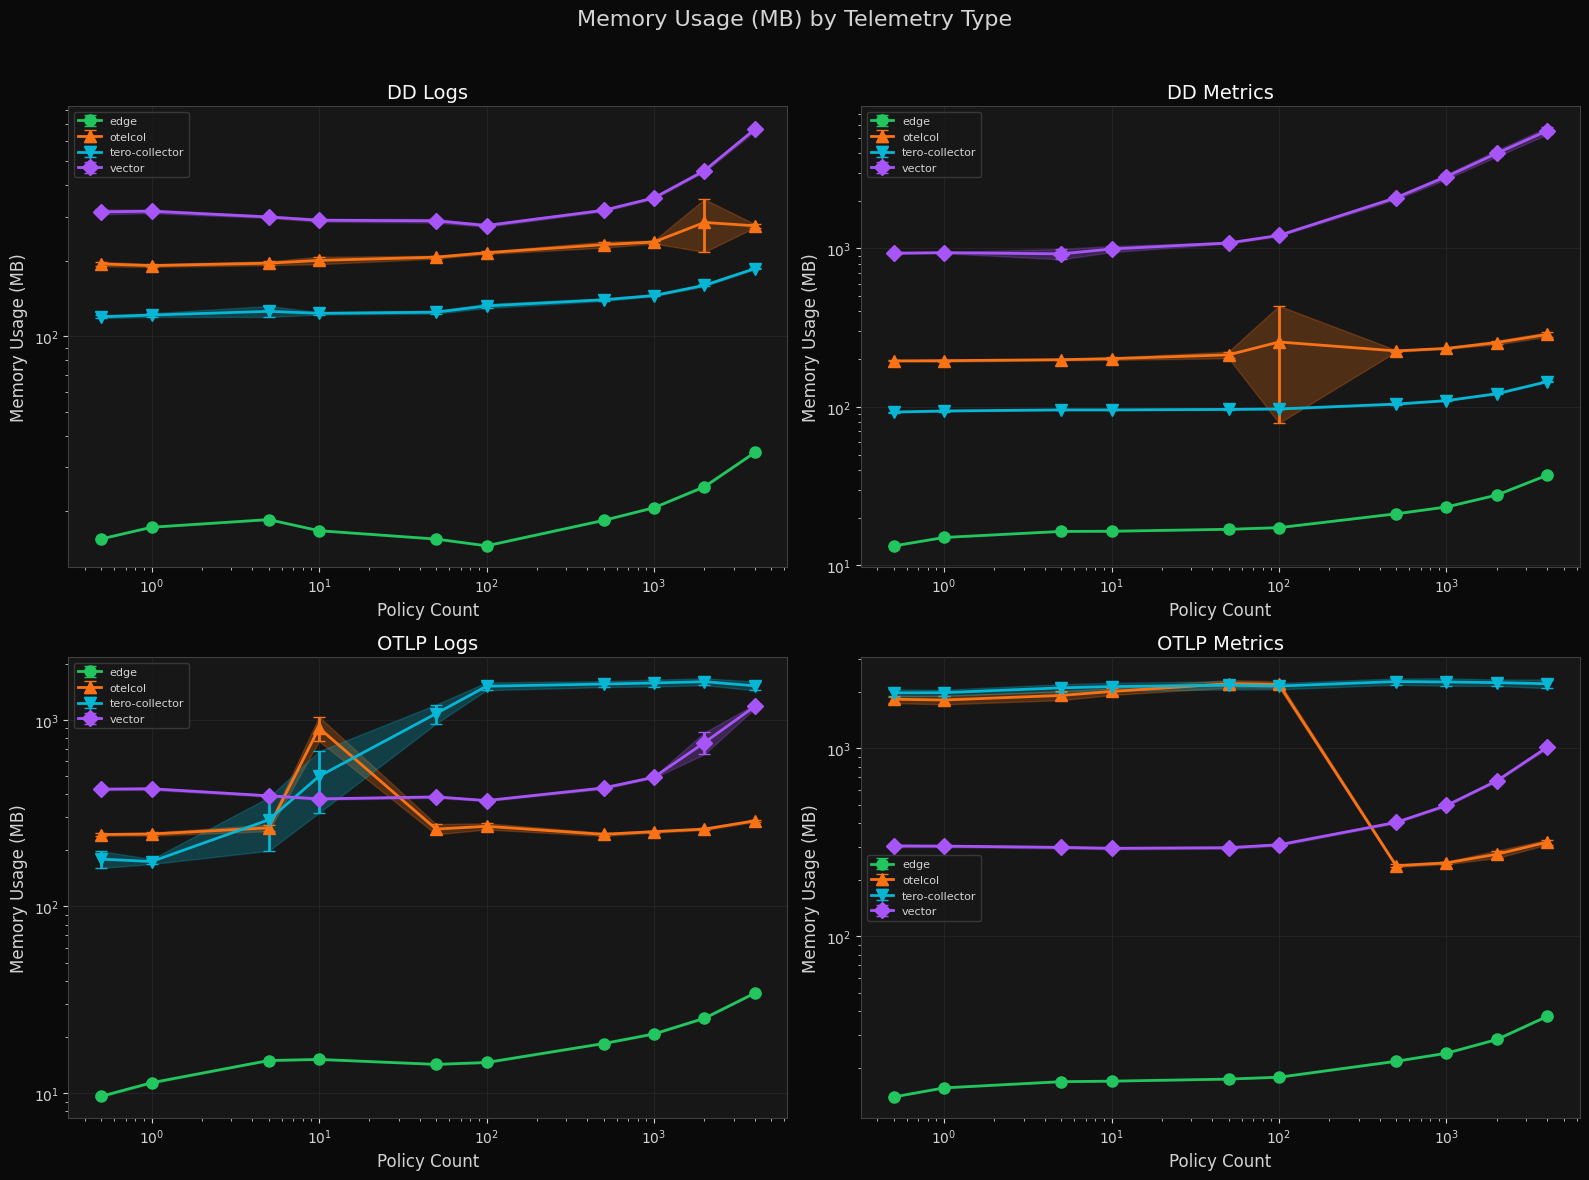
Tero Edge starts in the single-digit MB range and reaches ~50 MB at 2000+ policies. The tero-collector holds at 100–200 MB for DD traffic but rises to ~1–2 GB for OTLP logs at mid-range policy counts before settling. Vector grows unbounded with policy count, while otelcol sits in the middle.
CPU Usage by Telemetry Type
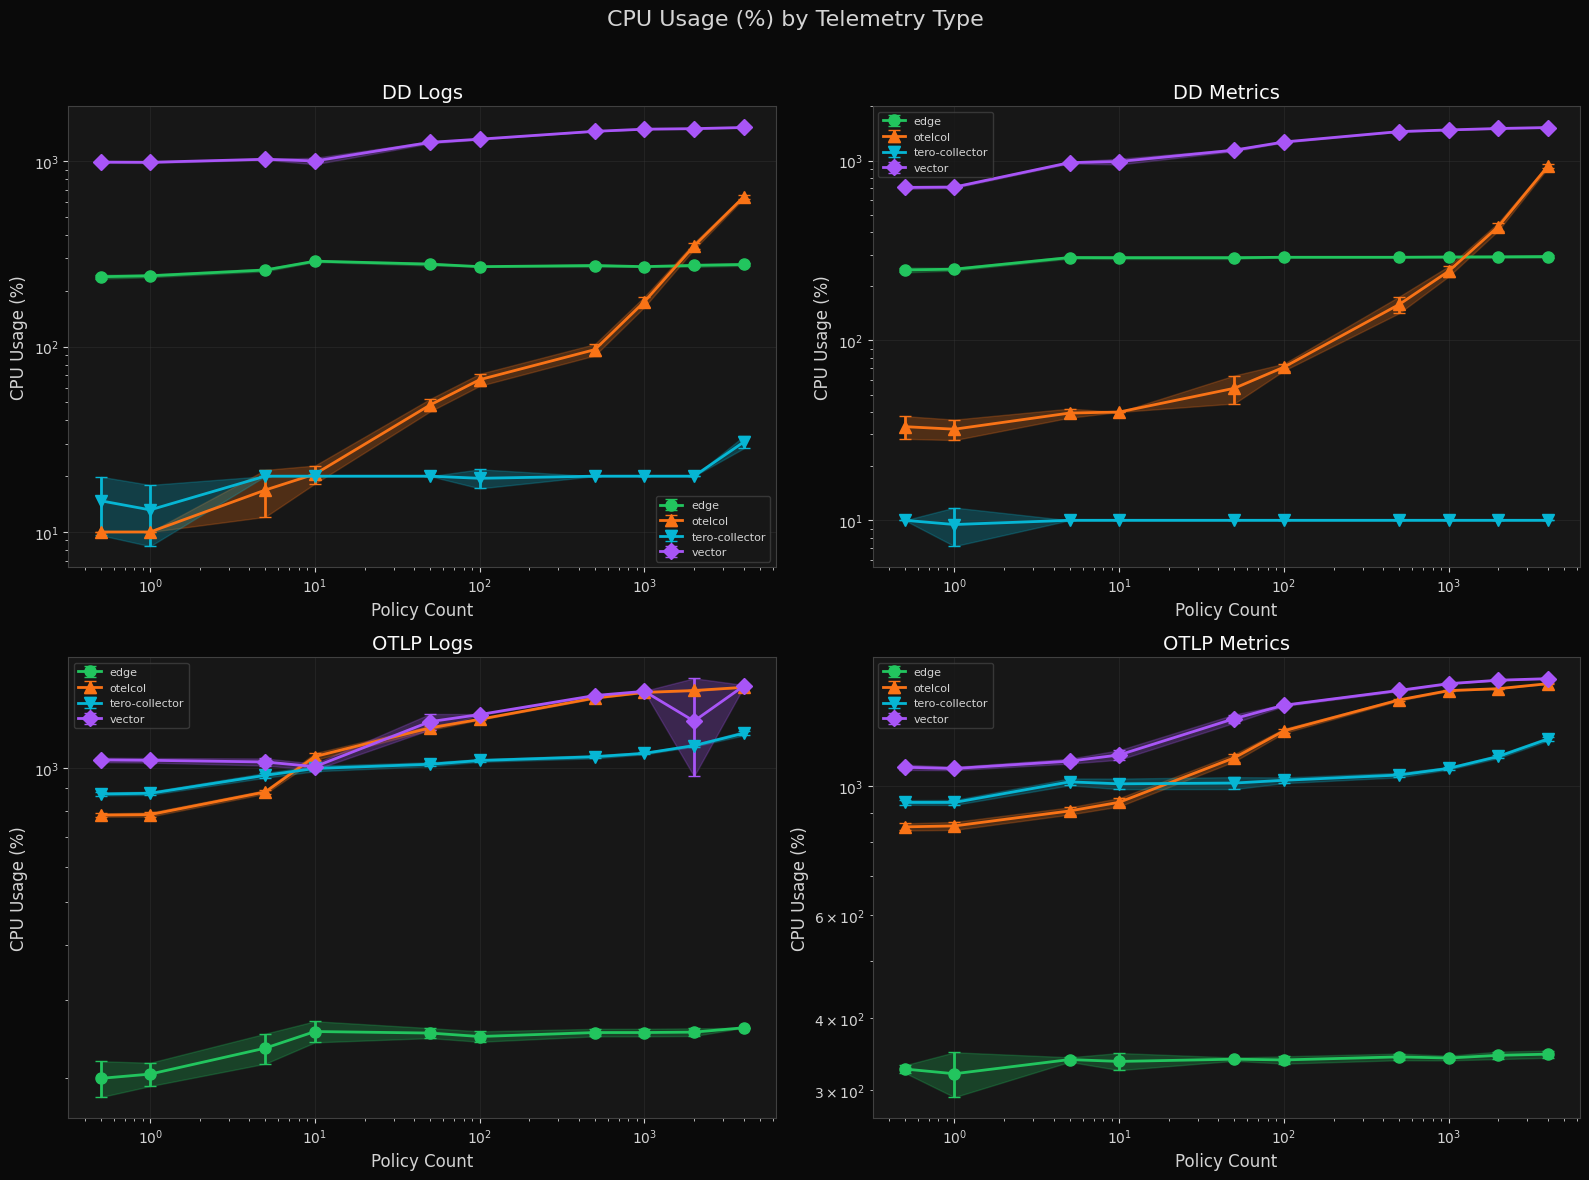
Tero Edge holds flat at ~200–300% CPU for DD Logs and DD Metrics regardless of policy count. Otelcol scales into the thousands of percent at high policy counts. The tero-collector sits at ~10–20% for DD workloads but climbs for OTLP traffic. Vector remains above 1000% across nearly all conditions.
A note on methodology: CPU usage on macOS is reported as a percentage of a
single core, so 1600% means 16 cores fully utilized. macOS does not expose
per-process CPU metrics the same way Linux does — there is no /proc filesystem
or cgroup accounting. We sampled CPU via ps at regular intervals during each
benchmark run. These numbers are directionally accurate for comparing binaries
against each other on the same machine, but should not be compared directly to
Linux-based benchmarks.
P50 Latency by Telemetry Type
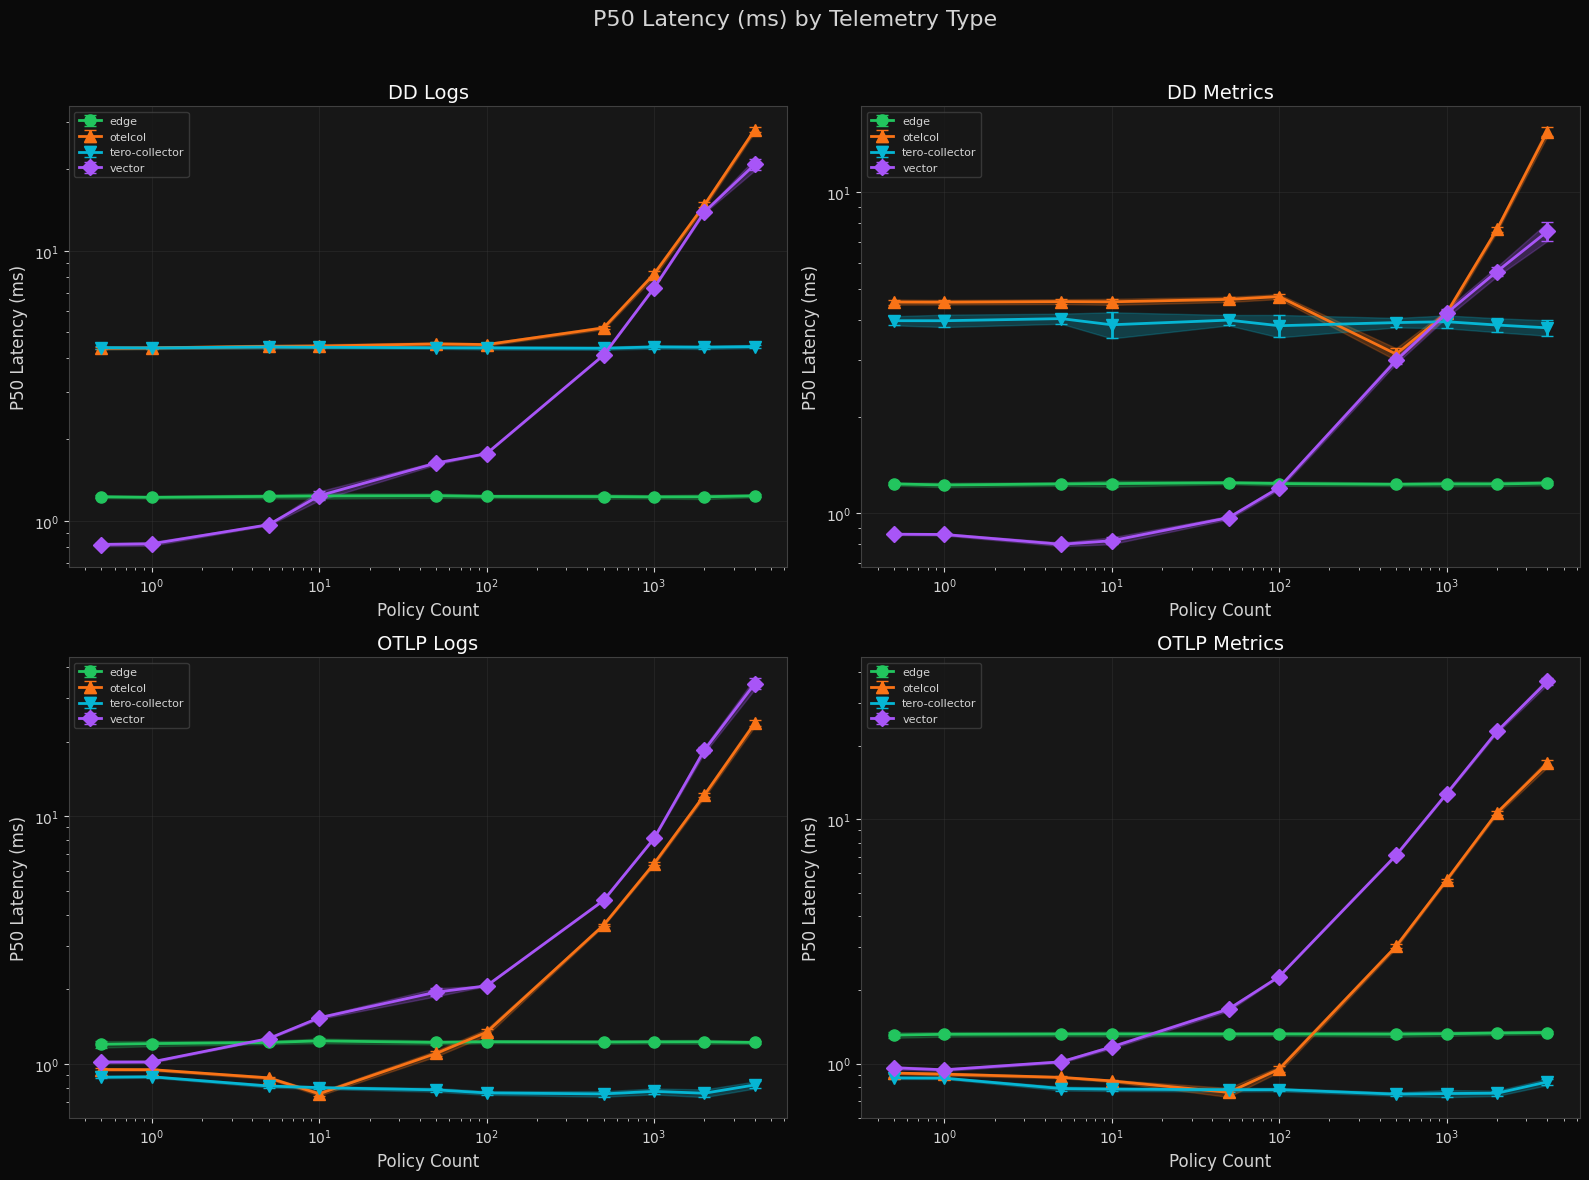
Tero Edge P50 latency sits at 1–2 ms across all telemetry types, flat through 2000 policies. The tero-collector is sub-millisecond on OTLP workloads at low policy counts. Otelcol and Vector both increase sharply beyond 100 policies, with Vector crossing 50 ms P50 on OTLP metrics at high load.
Box Plots (Distribution by Binary)
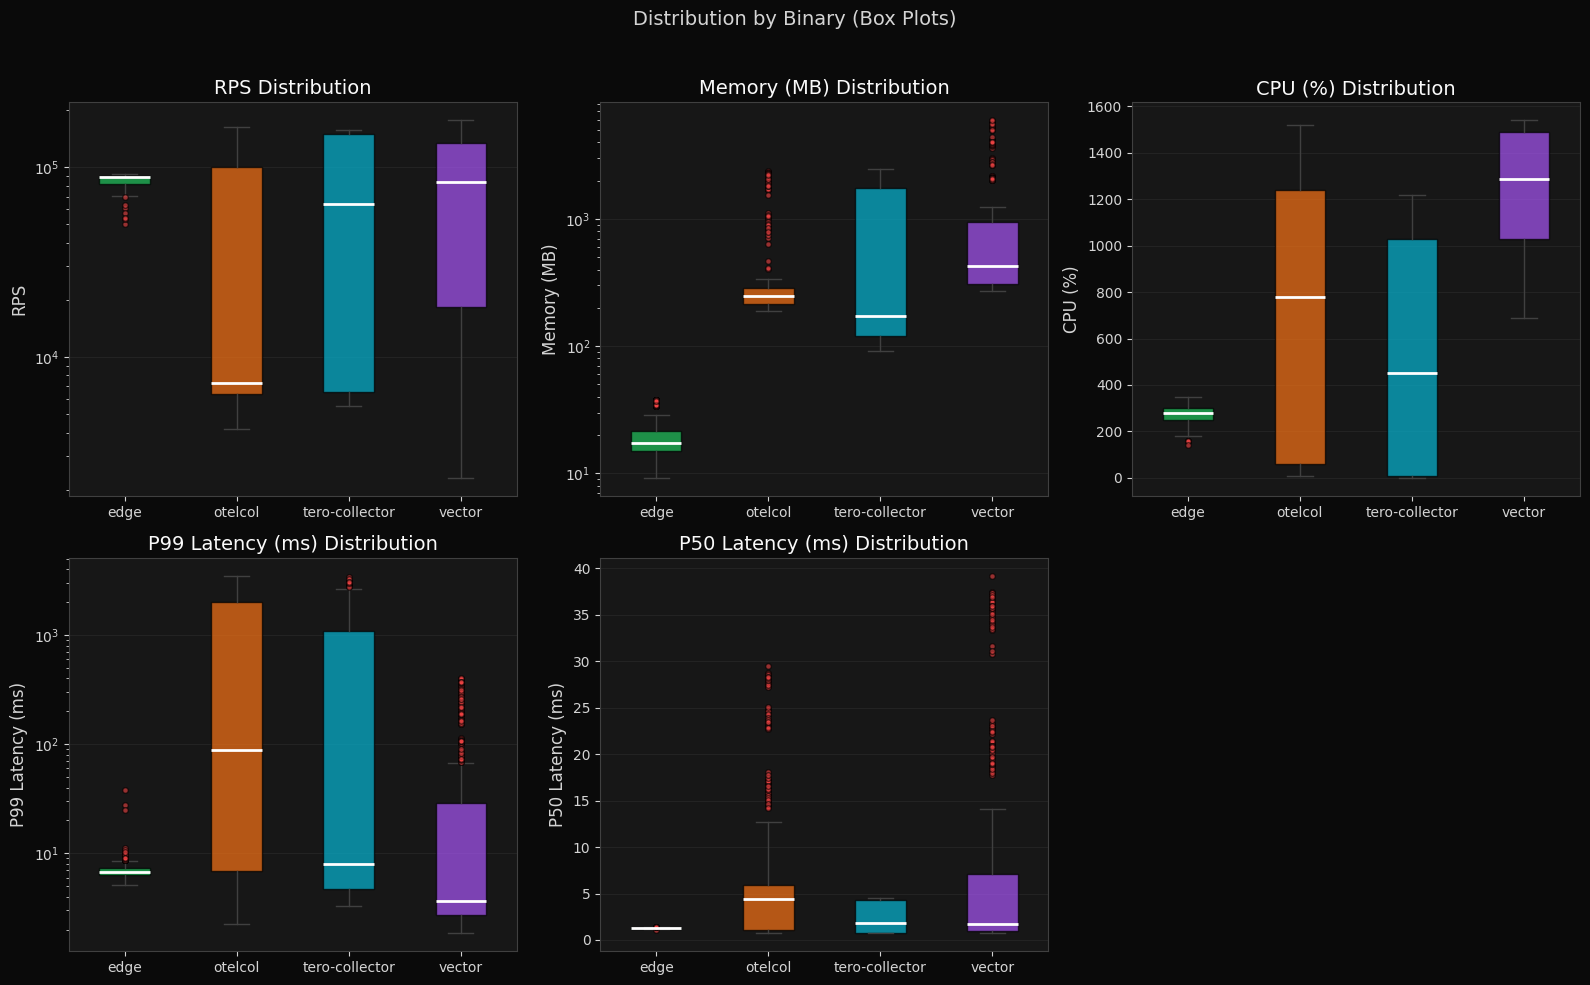
Tero Edge has the tightest distribution across all metrics: RPS around 100K, memory at ~15–20 MB median, P99 latency at ~8 ms with minimal variance. The tero-collector shows higher throughput potential than otelcol but wider variance in CPU and latency. Vector and otelcol both have wide interquartile ranges across runs.
Summary
The data shows that policies do scale in constant time. As policy count increases, RPS for Vector and the collector drop exponentially while the tero-collector and tero-edge proxy retain their original RPS. The edge proxy uses far less memory to achieve equivalent performance, and is the most consistent across every category – RPS, memory, and CPU. The modified Tero collector outperforms the unmodified contrib distribution.
So what?
We're excited to continue developing in the open – we hope to land the policy OTEP in the coming months and donate the implementations into OTel afterward. Please reach out if you ever find yourself saying "I wish somebody just fixed this!" or "Wouldn't it be great if…" We'd love to hear all about it.
For a deeper look at the design, tradeoffs, and implementation details behind policies, read Part 2: The Technical Details of Policies for the Nerds Who Care.
Find Jacob at KubeCon EU March 23rd-27th 2026 in Amsterdam to chat more, or reach out at [email protected].